

Towards a manual for the most common restart
Whether you love long attacking throw-ins or hate them, there is no denying that they’ve become both a key feature and flashpoint in men’s soccer in the past year. John Muller likely sparked a renaissance of the tactic (and a soon-to-be Arsenal title) with his 2023 article for The Athletic, and Joe Lowery and I borrowed his method for Backheeled when Minnesota United started longthrowmaxxing in 2025 (Editor’s note: Minnesota work with Mike Imburgio through ASA’s firewalled consulting arm). But while each game has about 40 throw-ins on average, only about 10 of those throws happen close enough to reach the box. But apart from Formerly Called Twitter jokes about consultant Thomas Grønnemark, there hasn’t been much commentary about all the other ones in popular media or public analytics circles. The only exceptions I’m aware of are Eliot McKinley’s 2018 two-part opus on this very website, and some recent academic work on the top 5 European leagues that, if you like in-text citations and interpreting regressions, is an excellent spoiler for the rest of this article.
Eliot did that work almost a decade ago (before Game of Thrones jumped the shark), and I thought it was time to replicate and extend those findings with all the amazing infrastructure that ASA has built since the days of CSV files on Dropbox. In addition to models estimating throw completions and retained possession, I also analyze the goals added for possessions following throws to assess the value of throw choices. This allows me to find the MLS throw-in MVPs and offer an expanded set of (very general) rules for approaching these overlooked moments of play.
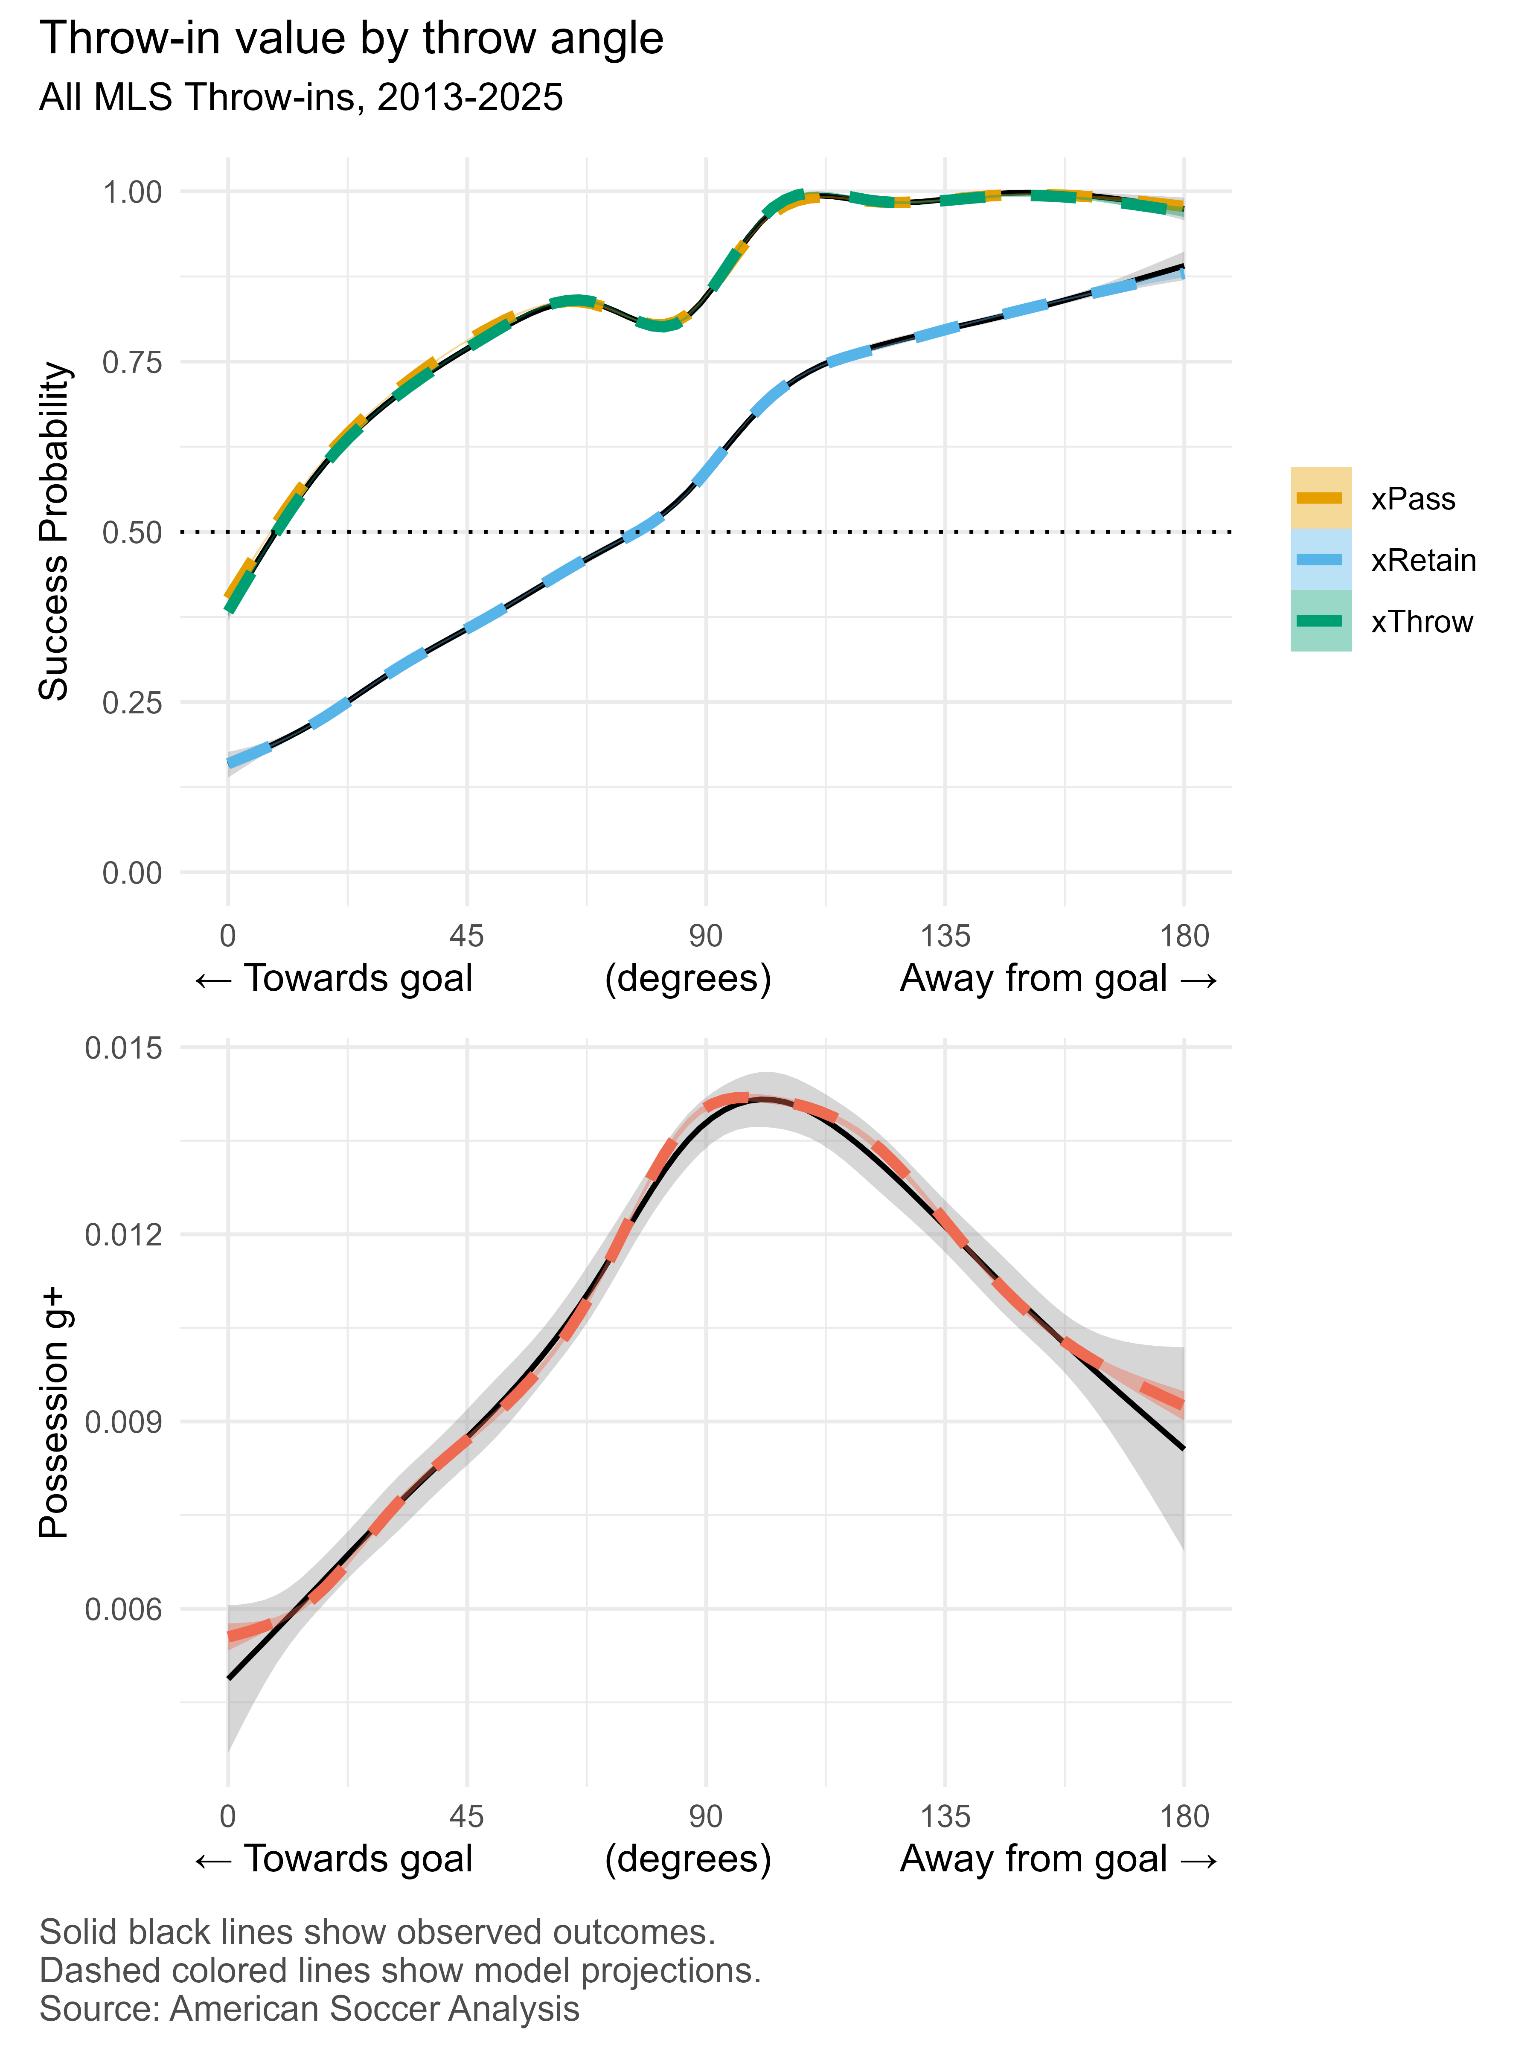
Before we dive into the updated data, let’s quickly recap the first two seasons of Game of Throw-ins. In Part One, Eliot took ASA’s trusty xPass model and tweaked it for throws in two ways: adding a predictor for time since the previous event (xThrow), and using retaining the possession as another measure for a successful throw (xRetain). We also need to remind ourself of some important definitions: 1) a successful throw (measured by xThrow) is a throw that is touched by a teammate first 2) a retained throw is a throw that your team has possession afterwards. You can chuck it at someone’s head, they flick it on to an opposition defender (successful, but not retained), or you can Chauncey Billups it off a defenders back and take the ball yourself (unsuccessful, but retained).
After picking apart these models, he offered three lessons for coaches to instill in players:
-
Don’t let the ball go out of bounds deep in our own half if you can prevent it. It is basically a coin-flip whether or not your team will retain possession after a throw-in in your defensive third. So if there is not a lot of pressure from an opponent, hustling a bit to keep the ball in bounds is a smart decision.
-
Use when our opponent has a throw-in in their defensive third as a pressing trigger. The likelihood of a turnover following a throw-in is high so be prepared to take advantage of it.
-
Take your throw-ins 5-10 seconds after the ball goes out of play. I would have my players immediately get into positions to receive a throw-in before my opponents get set. I’d also employ some gamesmanship (at least in CCL), perhaps having my players try to slow down an opponent from taking a throw-in to allow my defense to get into shape.
One of the interesting developments when reading back through the original research is that #2 has definitely become a thing. More or less every week we see teams smash kickoffs directly out of play near the corner flag to set up their press to start the game. Neat.
In Part Two, Eliot clustered MLS teams based on throw-in direction choices, and evaluated teams and players on their retention success compared to model expectations. He found that while most teams had no defined style, some were clearly coached to throw forward, and others were told to spread the ball around, and especially backwards.
There was a lot of noise in these results, but I noticed that two teams and their fullbacks had particular success retaining throws by spreading the ball around and taking them backwards, and they were coached by Gregg Berhalter and Peter Vermes who favored possession-focused styles at the time. More than anything, Part Two suggests that few coaches were paying particular attention to throws, and that throwing it backwards seems helpful for retaining possession, if that’s your thing (and it was Gregg’s and Peter’s thing).
While retaining possession is useful, having the goals added for every possession following each throw means we can push this analysis further. This lets us better understand how these decisions affect the immediate odds of scoring. Do throws down the line make up for their low success odds with increased goal danger? Can teams reduce their risk of turnovers while also generating attacking value? Which are the best throw choices in different areas of the pitch?
As I was working on the models, I realized that I was struggling just thinking through all the possible throws available. Consider a throw that a player receives right on the half line. That could have been taken 30 yards behind them, 30 yards in front, or anywhere in between, and that context drastically changes what the throw really is. Similarly, the spread of throw targets in the attacking third is surely different from the spread in the defensive third. How can I visualize this complexity when there are so many overlapping patterns? There’s really only one answer: it has to be interactive.