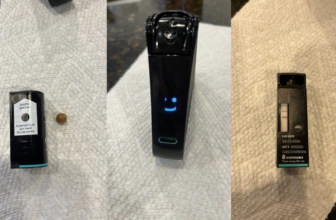
Nima is promoting a second study on the Nima gluten sensor entitled, “A Real-World Food Testing Study of the Nima Gluten Sensor.” Testing was done by Bia Diagnostics, the lab used by Gluten Free Watchdog since 2011.
What Nima is saying about the study on their social media platforms
“A new independent study from BIA Diagnostics Laboratories put NIMA up against real restaurant meals, ordered the way you’d actually order them: fried chicken, pasta, sandwiches, burgers, pizza. Half labeled gluten-free, half not. 200 tests. Every meal. Side by side with the gold-standard lab method (ELISA). The result? 99% agreement between NIMA and the lab. And the one case where results differed showed us something real: gluten isn’t always spread evenly through a dish, which is exactly why sample technique matters.”
We have questions and some of you have questions so we reached out to Bia Diagnostics for answers.
Was the study independent?
The study is being framed by the Nima team as an “independent study.” The actual study document reads, “Independently performed by Bia Diagnostics Laboratories.” We confirmed through Bia Diagnostics that they independently performed the actual testing, but the Nima team was involved in the study design and how the results were presented.
Why are results using the R5 ELISA (R7001) from R-Biopharm reported down to 1.421 ppm of gluten when the limit of quantification for this assay is 5 ppm of gluten?
5 parts per million is the lowest level of gluten that can be quantified using the R5 ELISA. 1 part per million of gluten is the limit of detection (this is a matrix dependent mean value). According to R-Biopharm (the assay manufacturer), results between the limit of detection (LoD) and the limit of quantification (LoQ) should NOT be reported as quantifiable amounts:
“Interpretation of results: Results between LoD and LoQ indicate a low analyte concentration in the sample. Calculated results show a high uncertainty in this area due to the RIDASCREEN® Gliadin 2024-06-03 32 / 37 method’s high variation below LoQ. Therefore, such results should not be reported with a quantitative value, but qualitative as “< LoQ.”
We confirmed with Bia Diagnostics that the decision to report exact numbers (3 digits after the decimal point no less which indicates a high level of precision) was the Nima team’s choice.
Was the R5 ELISA method followed?
The study is being framed by the Nima team as putting the gluten tester up against the “gold-standard lab method (ELISA).” So, was the R5 ELISA method followed?
The instructions from R-Biopharm for this method include:
“Homogenize (grind thoroughly to powder and mix well or mix well a solution respectively) well a sufficient amount (e.g. 50 g or 50 mL) to ensure taking a representative test portion of sample.”
We confirmed through Bia Diagnostics that instructions for the R5 ELISA were not followed for the discrete meal tests. In the opinion of Gluten Free Watchdog, this deviation from the validated method should have been clearly noted in the study write-up. For the first part of the study (discrete samples), the R5 ELISA was used almost like it was a Nima—R5 ELISA instructions were not followed (i.e., at least 50 g homogenized, 0.25 g tested). And in the second part of the study, the Nima was used more like the R5 ELISA in the sense that the pea-sized samples were taken after the meal was homogenized. While an interesting approach, if the R5 method is not followed, then the study is not assessing the Nima gluten sensor against the gold standard lab method.
Where were the pea-sized amounts taken from the meals?
We were advised by Bia Diagnostics that samples collected were a pea-sized amount of a representative ratio of meal components. For pizza this was approximately 1/3 cheese, 1/3 sauce, 1/3 crust. For sandwiches this was approximately 1/3 bread with spread, 1/3 meat and cheese, 1/3 vegetables. Single-component samples were not taken.
Gluten Free Watchdog Study Assessment
If the goal of this study is as the study write-up states, “to assess the performance of the Gluten Sensor when testing real-world samples ordered from restaurants, using the AOAC 2012.01 Gluten ELISA method as a reference, as it is a CODEX Type 1 method for measuring Gluten in foods” then both methods must be performed as intended. The ELISA is a Codex Type 1 method only when the method is actually followed.
If the R5 ELISA and the Nima Gluten Sensor are assessed as they are intended to be used, then only the discrete pea-sized samples tested with the Nima should be used and only the homogenized meal samples tested using the R5 ELISA should be used.
The following then becomes the data for the gluten-free meals:
Fried Chicken 1:
All 3 discrete Nima results: Safe to eat
Both homogenized R5 ELISA results: No gluten detected
Fried Chicken 2:
All 3 discrete Nima results: Safe to eat
Both homogenized R5 ELISA results: No gluten detected
Pasta 1:
All 3 discrete Nima results: Gluten found
Homogenized R5 ELISA results: 18.717, 16.538
Pasta 2:
All 3 discrete Nima results: Safe to eat
Both homogenized R5 ELISA results: No gluten detected
Sandwich 1:
2 discrete Nima results safe to eat, 1 discrete gluten found
Both homogenized R5 ELISA results: No gluten detected
Sandwich 2:
All 3 discrete Nima results: Safe to eat
Both homogenized R5 ELISA results: No gluten detected
Hamburger 1:
All 3 discrete Nima results: Safe to eat
Both homogenized R5 ELISA results: No gluten detected
Hamburger 2:
2 discrete Nima results safe to eat, 1 discrete gluten found
Both homogenized R5 ELISA results: No gluten detected
Pizza 1:
2 discrete Nima results gluten found, 1 discrete safe to eat
Homogenized R5 ELISA results: 1 No gluten detected, 2.360
Pizza 2:
2 discrete Nima results gluten found, 1 discrete safe to eat
Homogenized R5 ELISA results: 15.515 ppm, 6.090 ppm
The following then becomes the data for the gluten-containing versions of these meals:
All discrete Nima results: gluten found
All homogenized R5 ELISA results: > 80 ppm
Results for gluten-free meals
In 4 out of the 10 gluten-free meals tested (40%), results using the Nima (3 discrete samples) were inconsistent—sometimes the result was gluten found, other times the result was safe to eat. This doesn’t make any of the individual results “wrong” but it does hint at why the sensor is problematic—it isn’t testing a homogenized sample when used by consumers. It is testing discrete pea-sized portions.
In 9 out of the 10 gluten-free meals tested (90%), results using the R5 ELISA (each meal tested twice from the homogenized sample) were consistent. For the one inconsistent result (pizza 1), both results were below the limit of quantification for the assay of 5 parts per million of gluten. However, one result was also below the limit of detection. According to R-Biopharm, results should be reported as < LoD and < LoQ. Using numbers this would be < 1 ppm and < 5 ppm.
Lingering issues about the Nima gluten sensor
According to Nima’s Instagram account, “A positive result is clear. Don’t eat that dish.” From the Nima website: “While NIMA detects gluten at 10 ppm and sometimes even lower. That means NIMA may identify gluten that is below the FDA’s threshold but still present in trace amounts. If you are highly sensitive to gluten, we suggest that you do not eat this food since it might contain trace amounts of gluten.”
Nima reported gluten found when results were below the lower limit of quantification when tested with the R5 ELISA. How is a consumer to know what gluten found means when the sensor reports a gluten found result well below its stated threshold? Does it mean < 5 ppm of gluten was found? Does it mean 5 or greater ppm of gluten was found? Does it mean 10 ppm or greater of gluten was found? Nima can of course calibrate their sensor as low as they want but it should be relatively consistent across a wide variety of matrices.
Related issues
How many capsules does the Nima team recommend consumers use on a meal? How should users interpret inconsistent results? We were not able to find any information on the Nima website that addresses these issues. What the Nima website does say about meals is this: “Tip: When testing an entire meal, use the teeth on the bottom of the capsule cap to dab food from different areas of your plate. Wipe off any food from the outside of the capsule before inserting into the NIMA sensor.”
Lingering issues about restaurant meals
Gluten test results using the R5 ELISA (and following the proper method) for two meals are concerning—Pasta 1 (18.717, 16.538) and Pizza 2 (15.515 ppm, 6.090 ppm), even though all results were below the FDA threshold for gluten in packaged food products of 20 ppm. Gluten Free Watchdog would love to know the restaurants these meals came from so we could commission some additional testing!
See also:
R-Biopharm Ridascreen Gliadin R7001 Information
Study write-up.