
Sweet 16…. How’s my AI bracket doing? – Why Is The Internet Broken?

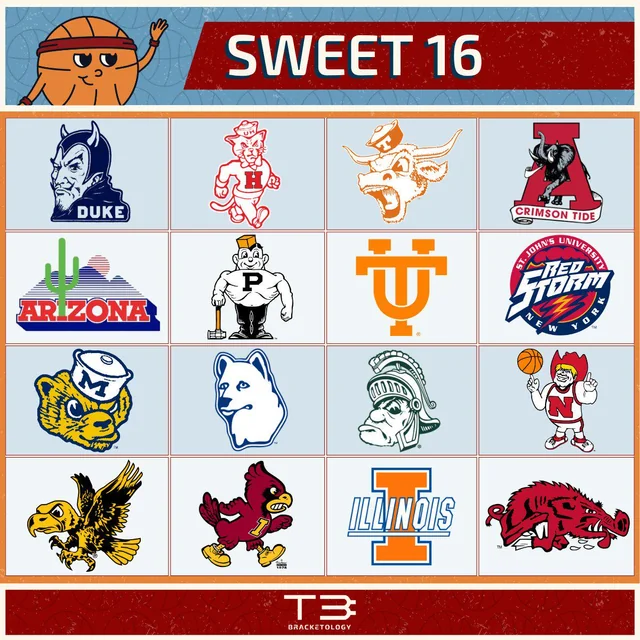
Last week, I let Claude AI create the blog I Let an AI Fill Out My Bracket. Here’s What Happened because I was curious how well an AI could predict something as seemingly random as the NCAA men’s basketball tournament.

The key question here:
Could logic and data make sense out of madness?
Why AI?
Going into this exercise, I knew that AI is less about actual original thought and more about data – collecting, collating, processing, analyzing. I didn’t expect AI to be able to pick a perfect bracket – especially not in a vacuum where the initial prompt would be “Fill out my bracket for me.” There would be too much variance and the AI would probably just use whatever the other experts out there were saying.
So I knew I needed to have some initial criteria and data gathering parameters to start with. Now, luckily I have watched a *ton* of college basketball over the past 40-ish years, so I feel like I have a pretty good idea of what it takes for teams to win games. But I’ve tried to do manual data collection and analysis for the NCAA tournament before -it’s a LOT of work. 64 teams? Collecting stats for each one of them? Analyzing head to head records? Cherry picking which data matters to you?
Plus, it’s kind of boring. It’s exactly the right type of work for an AI.
Why Claude?
AI has a number of models and applications available to use, but I chose Claude for 2 reasons:
- I’ve anecdotally heard that it’s one of the better choices out there
- Their recent ethical decisions in how its models are used
That simple.
What was my process?
As I mentioned, I didn’t just simply ask Claude to predict the tournament for me. The interaction was more about a process. What’s great about a chatbot is that I can ask it to summarize what I’ve been asking it. So, rather than try to piece together memories and re-read the entire thing, I just asked Claude to summarize for me.
From Claude…
Phase 1 — Establishing the Framework
The project started with a simple question: can an AI build a statistically rigorous NCAA bracket? Before touching a single team, we established what we were actually measuring. The initial model was built around three pillars — KenPom efficiency ratings, an 8-year upset database (2017–2024, ~65 games), and a confidence threshold rule that no pick could be made below 50%.
The 8-year historical analysis surfaced the first genuinely non-obvious finding: turnover rate, not seed differential, was the strongest predictor of upsets. Teams like NC State 2024, Princeton 2023, and Oral Roberts 2021 all shared elite ball security as their common thread.
Phase 2 — Adding Data Layers Iteratively
The model was refined through six distinct rounds of additional data, each prompted by a specific question, which I provided:
- Injuries were the first addition — and the most immediately impactful. Caleb Foster’s fractured foot (Duke), LJ Cason’s ACL (Michigan), Caleb Wilson’s thumb (UNC), JT Toppin’s ACL (Texas Tech), Braden Huff’s knee (Gonzaga), and Mikel Brown Jr.’s back (Louisville, confirmed out for the full first weekend) each produced meaningful confidence shifts. The Brown update alone flipped the Louisville pick to South Florida — though Louisville ultimately proved that wrong.
- Last-10-games form was the second layer. This produced the most dramatic swings: Kansas’s 4-6 record and 22-point blowout loss to Houston in the Big 12 tournament dropped them from a comfortable pick to a 44% confidence level, which eventually flipped the pick to St. John’s. Florida’s 11-game winning streak and Vanderbilt’s SEC tournament championship both bumped confidence upward. Iowa State’s late-season 5-5 stretch introduced the “volatile” flag that proved predictive.
- Quality wins vs. tournament teams refined the picture further. Arizona’s 12 ranked wins — tied with Duke for the most in the field — validated their 1-seed. St. John’s 19-1 record over their last 20 games (confirmed by Torvik as 10th-most efficient in the country over that stretch) was the statistical backbone of the Kansas upset pick.
- Foul rate was the most underappreciated addition and ultimately one of the best validated. Historical data showed teams committing more than 18 personal fouls per game lost at-seed matchups at a 38% higher rate when facing opponents shooting above 75% from the free throw line. This flagged Georgia (20.2 PF/g), Alabama (19.8), Iowa State (19.1), and Kentucky (18.9) as elevated-risk teams — and flagged Virginia (13.8), Houston (14.5), and Saint Mary’s (14.8) as structurally disciplined. The Arizona-Utah State game became the clearest validation of this model: Utah State committed 25 fouls (9 above their season average), Arizona went to the line 39 times and won by 12 despite shooting below their scoring average.
- Torvik T-Rank was added as a cross-check against KenPom, surfacing several divergences that changed picks. Michigan’s AdjDE was #1 nationally per Torvik — stronger than KenPom suggested, which hardened the Michigan over Iowa State pick. Illinois had the #1 adjusted offense nationally per Torvik, which made the Houston S16 matchup the closest analytical call in the bracket. Texas Tech’s defensive efficiency had collapsed from Torvik #24 to #119 after Toppin’s injury — a fact the full-season KenPom number obscured. Gonzaga’s offense dropped from #29 to #68 without Huff, which ultimately flipped the S16 pick to Purdue.
Phase 3 — Structural Corrections
The bracket went through several significant structural fixes that were caught through user prompting rather than self-identification:
- Pod structure was wrong throughout the original bracket. The 7 and 10 seeds were shown playing 3 and 14 seed winners in R32, when they correctly face the 2 and 15 seed winners. Kentucky was shown facing Virginia in R32 when the correct matchup was Kentucky vs Iowa State. This error persisted across a dozen updates.
- National semifinal pairings were wrong — East vs West and Midwest vs South, when the correct structure is East vs South and West vs Midwest. This changed the championship game from Duke vs Florida to Duke vs Arizona.
- Both changes together produced a third cascading error: both Florida and Houston had been listed as Final Four teams from the South region, which is structurally impossible. Houston was correctly eliminated by Florida in the Elite Eight, with only Florida advancing.
- Sub-50% picks required a full audit pass. Six winner picks and four upset picks were below the 50% threshold we had established as the model’s own rule. The audit flipped Iowa State over Michigan (E8, was 36%), Gonzaga over Purdue (S16, was 40%), VCU over UNC (R64, was 45% for UNC), St. John’s over Kansas (R32, was 44% for Kansas), Georgia over Saint Louis (R64, was 49%), and Utah State over Villanova (R64, was 47% for Villanova).
Phase 4 — Post-Tournament Validation
After the first two rounds concluded, the model was tested against actual results across 52 games — 46 correct, 88.5% overall.
The metric alignment analysis across games with full box scores produced several important findings:
Foul rate and rebounding aligned with the winner at 67% each — the strongest validated predictors. Points off turnovers aligned at 60%. Standalone turnover count was the weakest at 50%, confirming the pre-tournament suspicion that it needed to be replaced.
The six misses each had a clear root cause: Prairie View A&M’s 9-1 hot streak overwhelmed Lehigh’s Whitlock-dependent offense. TCU beat Ohio State in an 8/9 coin-flip. Louisville’s McKneely stepped up with 23 points to offset Brown’s injury — our model correctly flagged the risk but picked the wrong outcome. High Point drew 28 free throw attempts (exactly the profile our foul-rate model had flagged as dangerous for Wisconsin) and won. Texas A&M’s “Bucky Ball” pace strategy prevented Saint Mary’s from ever getting to the free throw line, neutralizing their #1 FT% nationally advantage. Iowa beat Florida on Folgueiras’s go-ahead three with 4.5 seconds left — Chinyelu’s four fouls in limited minutes had removed Florida’s defensive anchor, applying the foul model in reverse.
The Final Model — Nine Factors in Priority Order
By the end of the process, the model incorporated:
- KenPom adjusted efficiency (offense and defense)
- Torvik T-Rank (particularly for recent-trend divergences from KenPom)
- 8-year upset database with identified warning signs
- Injury reports (player-by-player, confirmed sources only)
- Last-10-games form
- Quality wins vs tournament-caliber opponents
- Foul rate (both committed and drawn)
- Assist-to-turnover ratio (added after R32 analysis)
- Season average deviation patterns (added after R32 analysis)
The one rule that held throughout: every pick must carry at least 50% confidence. If the model says a team wins less than half the time, that team is not the pick.
So, how’s Claude doing?
Going into this, I had no expectations of how this would pan out. I simply wanted to see what would happen. But after the first weekend, I think I’ll be doing this type of thing every year because Claude is killing it. 99.5% percentile of all brackets on ESPN, and top 150K. Now, max points is kind of low, since Florida lost (and is in Claude’s Final Four), but overall, not bad. Granted, Claude *did* pick a lot of chalk…

I created my own non-AI bracket to compare (using data that Claude parsed for me) and admittedly, Claude is doing a bit better:

The reality is, they’re *pretty* close. And it’s not because Claude is smarter. It’s because it can parse and analyze WAY more data than I could ever dream of in a much shorter timeframe. This exercise would take me weeks and dozens of spreadsheets. Claude did it in a leisurely evening while I watched TV and asked it a few questions. It also helped me refine some of the data I found important, so I expect future endeavors to be even better.
Now, let’s see how this weekend plays out!



x5y1gy
vucqgd