
Why Gold and Oil Are Both Climbing Ahead of Friday’s Jobs Report (Aug 31 – Sep 4)

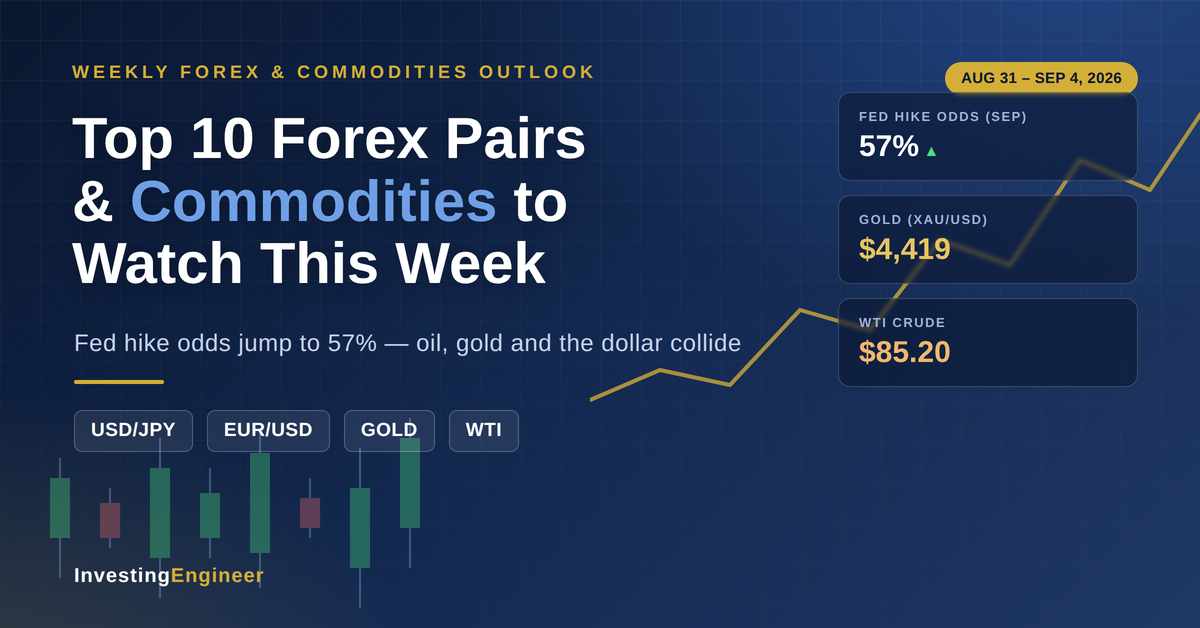
If you only look at one week of markets this quarter, this might be it. Federal Reserve Chair Kevin Warsh just delivered one of the most hawkish speeches of his tenure, an unresolved military standoff over the Strait of Hormuz is keeping oil and gold both elevated, and Friday brings the single most-watched U.S. economic release of the month: the August jobs report. Layer on live rate decisions from two more central banks, and you have a week that genuinely deserves the term “pivotal.”
This guide walks through everything happening in currency and commodity markets between August 31 and September 4, 2026 — what’s scheduled, why it matters, and which currency pairs and commodities give you the clearest way to follow the story. We’ll explain the jargon as we go, so you don’t need a finance degree to follow along.
Quick Answer / TL;DR
- The Fed just turned more hawkish. A Jackson Hole speech from Fed Chair Kevin Warsh pushed the market’s odds of a September rate hike from 40% to 57% in a single week.
- Friday’s jobs report is the week’s biggest event. Nonfarm Payrolls (forecast: 12,000 jobs added, after July’s surprise -23,000 contraction) will heavily influence whether the Fed actually hikes on September 15–16.
- Oil and gold are both climbing — for different reasons. An unresolved U.S.–Iran conflict over the Strait of Hormuz is keeping oil elevated, while gold is being driven by safe-haven demand and concerns about U.S. government debt, even against a stronger dollar.
- Two more central banks make live decisions this week: New Zealand’s RBNZ and the Bank of Canada, both on Wednesday, September 2.
- USD/JPY, EUR/USD, and gold are this week’s clearest stories to watch, alongside WTI and Brent crude given the ongoing Middle East risk.
Why It Matters: The Fed’s Hawkish Pivot
What Warsh Said at Jackson Hole
Every August, the world’s most influential central bankers gather in Jackson Hole, Wyoming for a symposium that often sets the tone for markets heading into fall. This year’s headline speaker was Federal Reserve Chair Kevin Warsh, and his message on August 28 was unambiguous: inflation isn’t cooling fast enough.
Warsh pointed to core PCE inflation — the Fed’s preferred inflation gauge, distinct from the more commonly cited Consumer Price Index (CPI) — running at 3.7% over the past 12 months and 4.1% on a six-month annualized basis. Both figures sit well above the Fed’s 2% target. “Underlying trends have not meaningfully improved,” he said, a notably blunt assessment for a Fed chair to make in public.
He also announced a shift away from “forward guidance,” the Fed’s longstanding practice of signaling its future policy moves in advance. Warsh argued this practice had “overstayed its welcome,” creating a kind of feedback loop where markets and the Fed become overly dependent on each other’s expectations — what he called a “hall-of-mirrors problem.” In plain terms: expect fewer hints about what’s coming next, and more decisions made meeting-by-meeting based on incoming data.
At the same time, Warsh described an economy that looks genuinely resilient: business investment is growing near 9%, corporate profits are up more than 20% year-over-year, and unemployment is holding steady at 4.1% with jobless claims near historic lows. That combination — inflation that isn’t falling fast enough, alongside a labor market that isn’t obviously weakening — is exactly the environment where a central bank feels it has room to raise rates rather than cut them.
The market reaction was immediate. Fed funds futures, which reflect what traders are willing to bet on the Fed’s next move, repriced the odds of a 25-basis-point rate hike at the September 15–16 meeting to roughly 57%, up sharply from about 40% just a week earlier. That’s a meaningful swing — and it’s why nearly every major currency pair moved in sympathy with the speech.
Why Friday’s Jobs Report Is the Week’s Biggest Catalyst
Nonfarm Payrolls, released on the first Friday of most months, is widely considered the single most important recurring economic release for currency markets. It measures how many jobs the U.S. economy added or lost in the prior month, and it’s one of the clearest real-time signals of economic health the Fed has available.
This month’s report carries extra weight for two reasons. First, July’s reading showed an outright contraction of 23,000 jobs — a surprisingly weak number that had, until Warsh’s speech, been feeding expectations that the Fed might hold rates steady or even cut. Second, because hike odds have already swung so sharply in one direction, Friday’s data has unusual power to move markets no matter which way it surprises. A strong report (comfortably above the 12,000 forecast, with unemployment holding near 4.1%) could push hike odds well above 70%. A weak report — especially another contraction — could send those odds sliding right back toward a hold.
Either way, expect the U.S. dollar, Treasury yields, and gold to move meaningfully within minutes of the 12:30 PM UTC release.
This Week’s Economic Calendar
Here’s the full lineup of scheduled events, in UTC. The heaviest data days are Tuesday, Wednesday, and Friday.
| Date | Event | Previous | Forecast | Impact |
|---|---|---|---|---|
| Mon Aug 31 | China Manufacturing & Non-Manufacturing PMI | — | — | Medium |
| Mon Aug 31 | Germany Preliminary CPI | — | — | Medium |
| Tue Sep 1 | China Caixin Manufacturing PMI | — | — | Medium |
| Tue Sep 1 | Germany Preliminary HICP | — | — | Medium |
| Tue Sep 1 | US ISM Manufacturing PMI | 55.6 | 55.3 | High |
| Tue Sep 1 | US JOLTS Job Openings (Jul) | 7.36M | 7.4M | High |
| Wed Sep 2 | Australia Q2 GDP | — | — | Medium |
| Wed Sep 2 | RBNZ Rate Decision & MPS | 2.25% | Hold | High |
| Wed Sep 2 | US ADP Employment Change (Aug) | 44K | 59.0K | High |
| Wed Sep 2 | Bank of Canada Rate Decision | 2.25% | Hold expected | High |
| Wed Sep 2 | US Fed Beige Book | — | — | Medium |
| Thu Sep 3 | China Caixin Services PMI | — | — | Medium |
| Thu Sep 3 | Switzerland CPI & Q2 GDP | — | — | Medium |
| Thu Sep 3 | UK Inflation Report Hearing | — | — | Medium |
| Thu Sep 3 | US Initial Jobless Claims | 203K | 203.0K | Medium |
| Thu Sep 3 | US ISM Services PMI | 54.1 | 53.8 | High |
| Fri Sep 4 | Eurozone Retail Sales | — | — | Low |
| Fri Sep 4 | Canada Unemployment Rate | — | — | Medium |
| Fri Sep 4 | US Nonfarm Payrolls (Aug) | -23K | 12.0K | Critical |
| Fri Sep 4 | US Unemployment Rate (Aug) | 4.1% | 4.2% | Critical |
Central Bank Watch: Who’s Hawkish, Who’s Not
This week’s most unusual feature is how many major central banks are leaning the same direction at once. Quick definitions if you’re new to this: a “hawkish” central bank leans toward raising interest rates to fight inflation; a “dovish” one leans toward cutting rates to support growth.
| Central Bank | Policy Rate | Bias | Next Meeting |
|---|---|---|---|
| Federal Reserve | 3.50%–3.75% | Hawkish | Sep 15–16, 2026 |
| European Central Bank | 2.40% | Hawkish | Sep 10, 2026 |
| Bank of England | 3.75% | Hawkish (6–3 split) | Sep 17, 2026 |
| Bank of Japan | 1.00% | Hawkish / normalizing | Expected soon |
| Bank of Canada | 2.25% | Neutral / data-dependent | Sep 2, 2026 (this week) |
| Reserve Bank of Australia | 4.35% | Hold, hawkish undertone | Sep 29, 2026 |
| Reserve Bank of New Zealand | 2.25% | Hawkish hold | Sep 2, 2026 (this week) |
| Swiss National Bank | 0.00% | On hold / easing bias | — |
| People’s Bank of China | 3.00% (1Y LPR) | Neutral / supportive | — |
Notice how many of the largest economies — the U.S., the Eurozone, the UK, and Japan — are leaning hawkish at the same time. That’s a genuinely unusual alignment, and it’s a big part of why this week’s Forex moves are likely to be sharper than a typical week.
Sponsored
Two central banks — the RBNZ and the Bank of Canada — deliver live rate decisions
this Wednesday, September 2, on top of the Fed’s own hawkish pivot. If you want to follow
NZD and CAD directly as those decisions land, rather than just the headlines afterward,
Pepperstone
offers live pricing on both pairs around each announcement.
Top 10 Forex Pairs to Watch This Week
Ranked by how directly each pair captures this week’s biggest catalysts — not by trading popularity.
| Rank | Pair | Trend | Confidence | Primary Catalyst |
|---|---|---|---|---|
| 1 | USD/JPY | Bullish | 82% | Hawkish Fed vs. a BoJ still catching up |
| 2 | EUR/USD | Neutral-bearish | 76% | German inflation data ahead of Sep 10 ECB meeting |
| 3 | GBP/USD | Neutral | 70% | BoE testimony (6–3 MPC split) |
| 4 | USD/CAD | Neutral | 74% | Bank of Canada decision + oil prices |
| 5 | AUD/USD | Neutral-bearish | 68% | China PMI cluster + Australian GDP |
| 6 | NZD/USD | Neutral, event-driven | 65% | RBNZ rate decision |
| 7 | USD/CHF | Bullish, mixed | 63% | Fed hawkishness vs. CHF safe-haven demand |
| 8 | USD/CNH | Neutral | 60% | Chinese PMI data |
| 9 | EUR/JPY | Bullish | 62% | Hawkish ECB vs. gradual BoJ tightening |
| 10 | GBP/JPY | Bullish, high-beta | 58% | BoE testimony + broad risk sentiment |
USD/JPY is this week’s cleanest trade idea: the Fed just turned more hawkish while the Bank of Japan, though also tightening, is moving at a slower pace. That gap between the two countries’ interest rates — known as the rate differential — tends to attract money toward the higher-yielding currency, which is part of why USD/JPY has been trending higher. Friday’s jobs report is the pair’s key swing factor: a strong print could extend the trend, while a weak one could trigger a sharp reversal.
EUR/USD is a tug-of-war between two hawkish central banks. Tuesday’s German inflation data feeds directly into the ECB’s own September 10 decision (just after this research window), where a hike is already close to fully priced in by markets.
GBP/USD hinges on Thursday’s Bank of England testimony to Parliament. The Monetary Policy Committee’s last vote was a genuine 6–3 split, with three members already wanting to raise rates — so this isn’t a formality.
Sponsored
Build a Watchlist for This Week’s Top 10 Forex Pairs
USD/JPY, EUR/USD, GBP/USD, and the rest of this week’s featured pairs are all reacting to
the same hawkish Fed pivot — and Friday’s Nonfarm Payrolls report could move every one
of them within minutes. TradingView lets you build a free watchlist, set price alerts, and
follow live charts as the data lands.
Top 10 Commodities to Watch This Week
| Rank | Commodity | Trend | Confidence | Primary Driver |
|---|---|---|---|---|
| 1 | Gold | Bullish | 80% | Safe-haven demand + debasement trade |
| 2 | WTI Crude Oil | Bullish | 78% | Strait of Hormuz supply disruption |
| 3 | Brent Crude Oil | Bullish | 78% | Same Hormuz risk, tighter Gulf linkage |
| 4 | Silver | Bullish | 68% | Tracks gold + industrial demand |
| 5 | Natural Gas | Neutral-bullish | 55% | Seasonal storage + energy-cost pressure |
| 6 | Copper | Neutral | 60% | China PMI data |
| 7 | Platinum | Neutral-bullish | 52% | Precious-metals sentiment + autocatalyst demand |
| 8 | Palladium | Neutral | 48% | Supply concentration risk |
| 9 | Wheat | Neutral | 45% | Harvest progress + export demand |
| 10 | Soybeans | Neutral | 45% | US harvest + China import demand |
Sponsored
Watch Gold and Oil React to the Hormuz Headlines
Gold is up almost 9% in August, and WTI and Brent crude are both up more than 30%
year-over-year, largely on the back of the unresolved Strait of Hormuz conflict. TradingView’s
live commodity charts make it easy to see exactly how each headline moves gold, oil, and the
dollar in real time.
The Strait of Hormuz: Why Oil and Gold Are Both Climbing
If you haven’t been following it closely, here’s the background: the U.S. and Iran have been in an extended military standoff, with the Strait of Hormuz — a narrow shipping corridor that normally carries a huge share of the world’s seaborne oil — at the center of the conflict. A deadline for a negotiated deal expired on August 17 without resolution, and U.S. forces recently struck Iranian rocket launchers reportedly being positioned to mine the Strait, the first such strike in over a month.
The practical effect: oil flows through the Strait remain suppressed at an estimated 6–8 million barrels per day, well below the roughly double that amount that normally flows through under calm conditions, though broader Persian Gulf exports have partially recovered. That supply squeeze is the main reason WTI crude (around $85/barrel) and Brent crude (around $90/barrel) are both up more than 30% from a year ago. Qatar-mediated talks are reportedly continuing in the background, and an Iranian official has said resuming diplomacy “isn’t impossible” — so this situation could ease as quickly as it could escalate.
Gold’s story is related but distinct. Normally, a hawkish Fed and rising bond yields (the 10-year Treasury yield sits at 4.71%) would be a headwind for gold, since gold doesn’t pay any interest and becomes less attractive when yields rise. But gold has climbed almost 9% in August alone, driven by two forces working against that usual pattern: safe-haven demand tied to the unresolved Iran conflict, and what’s sometimes called the “debasement trade” — investors buying gold as a hedge against concerns that heavy U.S. government borrowing could erode the dollar’s long-term value. Whether that decoupling continues past Friday’s jobs report is one of the more interesting things to watch this week.
Sponsored
Trade the Oil-and-Gold Risk Premium Directly
The Strait of Hormuz situation can move WTI, Brent, gold, and oil-sensitive currencies like
CAD and CHF outside of any scheduled release. Pepperstone gives active traders competitive
spreads and fast execution across major Forex pairs and commodities — useful if you want
to react to headlines as they break, not just read about them afterward.
Bull vs. Bear: Four Assets to Watch
| Asset | Bullish Scenario | Bearish Scenario |
|---|---|---|
| USD/JPY | Strong jobs report pushes Fed hike odds above 70%, widening the US-Japan rate gap. | Weak jobs report (another contraction) collapses hike odds and triggers a yen rally. |
| EUR/USD | Hot German inflation firms up ECB hike bets while US data disappoints. | Strong US jobs data outpaces the ECB’s own hawkishness. |
| Gold | Weak jobs data plus continued Hormuz tension keeps safe-haven demand intact. | Strong jobs data revives rising real yields as a headwind. |
| Oil (WTI/Brent) | Further Hormuz escalation extends the supply-risk premium. | A diplomatic breakthrough in Qatar-mediated talks eases the premium quickly. |
Risks to Watch This Week
- A binary jobs report. Hike odds have already swung 17 percentage points in a week — Friday’s data has unusual power to move markets sharply in either direction.
- Strait of Hormuz escalation. Any fresh military action could send oil, gold, and safe-haven currencies moving sharply outside the scheduled calendar.
- A crowded gold trade unwinding. August’s near-9% rally has some of the hallmarks of a positioning-driven move that could reverse quickly on a hawkish surprise.
- Two live rate decisions (RBNZ, Bank of Canada) that could surprise independent of the broader US dollar story.
- Weak Chinese PMI data reviving global growth concerns just as the Fed leans more hawkish.
None of these are predictions — they’re the specific things that could move markets away from the current consensus. Balanced positioning and awareness of both sides of each story matter more than usual this week.
Key Takeaways
- Fed Chair Kevin Warsh’s hawkish Jackson Hole speech pushed September rate-hike odds from 40% to 57% in one week.
- Core PCE inflation is running at 3.7% year-over-year, well above the Fed’s 2% target.
- Friday’s Nonfarm Payrolls report is this week’s single most important data release.
- The Strait of Hormuz conflict remains unresolved and is the main driver behind oil’s 30%+ year-over-year gain.
- Gold is up almost 9% in August despite a hawkish Fed, driven by safe-haven demand and debasement-trade concerns.
- The ECB, Bank of England, and Bank of Japan are all leaning hawkish alongside the Fed — an unusually synchronized stance.
- The RBNZ and Bank of Canada both deliver live rate decisions on Wednesday, September 2.
- USD/JPY is this week’s cleanest expression of the hawkish-Fed-vs-slower-BoJ theme.
- China’s PMI releases this week are the key read on AUD, NZD, and copper.
- Every scenario in this article should be read as a possibility, not a prediction — this is an unusually two-sided week.
FAQ
Will the Fed raise interest rates in September 2026?
As of this week, markets estimate roughly 57% odds of a 25-basis-point hike at the Fed’s September 15–16 meeting, up from about 40% the prior week. That’s not a certainty — it will depend heavily on this week’s employment data, particularly Friday’s Nonfarm Payrolls report.
Why is gold rising even though the Fed is turning hawkish?
Normally, a hawkish Fed and rising bond yields would pressure gold lower. This month, though, safe-haven demand tied to the unresolved Iran conflict and concerns about U.S. government debt (the “debasement trade”) have outweighed that usual pattern, pushing gold up almost 9% in August.
What is the Strait of Hormuz and why does it matter for oil prices?
The Strait of Hormuz is a narrow shipping corridor between Iran and the Arabian Peninsula that normally carries a large share of the world’s seaborne oil trade. An ongoing U.S.–Iran military standoff has suppressed the amount of oil able to flow through it, which is the main reason oil prices are up more than 30% year-over-year.
Which currency pair is most affected by this week’s Fed news?
USD/JPY is generally seen as the cleanest expression of Fed policy shifts, since it directly reflects the interest-rate gap between the U.S. and Japan. A more hawkish Fed tends to widen that gap and support the dollar against the yen, all else being equal.
What is Nonfarm Payrolls and why does it move markets so much?
Nonfarm Payrolls is a monthly U.S. government report measuring how many jobs the economy added or lost in the prior month. It’s one of the clearest real-time signals of economic health available to the Federal Reserve, which is why it tends to move currency, bond, and commodity markets more than almost any other scheduled release.
What does “hawkish” mean in the context of a central bank?
A hawkish central bank leans toward raising interest rates (or keeping them higher for longer) to fight inflation. The opposite, “dovish,” describes a central bank leaning toward lower rates to support economic growth.
Related Reading
Conclusion
The week of August 31 through September 4, 2026 brings together two stories that don’t often collide this cleanly: a Federal Reserve that just turned meaningfully more hawkish heading into a genuinely uncertain rate decision, and a geopolitical conflict that’s keeping oil and gold elevated for reasons that have little to do with interest rates at all. Add two live central bank decisions and a cluster of Chinese data, and this is a week that rewards paying attention to the calendar rather than guessing.
Friday’s jobs report is likely to be the week’s loudest moment, but the Strait of Hormuz situation remains the wildcard capable of moving markets on any given day, calendar or not. As always, treat every scenario above as one possible outcome among several — not a forecast — and size any decisions accordingly.
Disclosure: The content on this page was produced with AI writing assistance under the editorial direction of a licensed Electrical Engineering practitioner and certified investor in different markets with over a decade of experience. All articles are reviewed and approved by the author before publication.
Promotion
Post Views: 436


