

Short answer: Open Search Console’s Generative AI performance report to measure impressions from AI Overviews and AI Mode. Compare 28-day and 90-day periods, then segment by page, country, device and search type. Use the main Performance report and analytics to evaluate clicks and conversions because AI impressions alone do not show whether visibility created business value.
This workflow changed in 2026. Older articles correctly said Google grouped AI feature traffic inside the normal Web performance data and did not provide a dedicated filter. That advice is now outdated. Google rolled out a separate Generative AI performance report worldwide on August 31, 2026.
What the Generative AI performance report includes
According to Google’s Generative AI performance report documentation, the Search report includes impressions from:
Google may add more supported features over time. Experiments in Search Labs are not included while they remain in active development.
The report currently focuses on impressions, meaning a link to your site was shown to a user inside a supported generative AI feature. It is a visibility report, not a complete citation-tracking or conversion-attribution system.
How to open the report
- Open the correct verified property in Google Search Console.
- Navigate to the Generative AI performance report for Search.
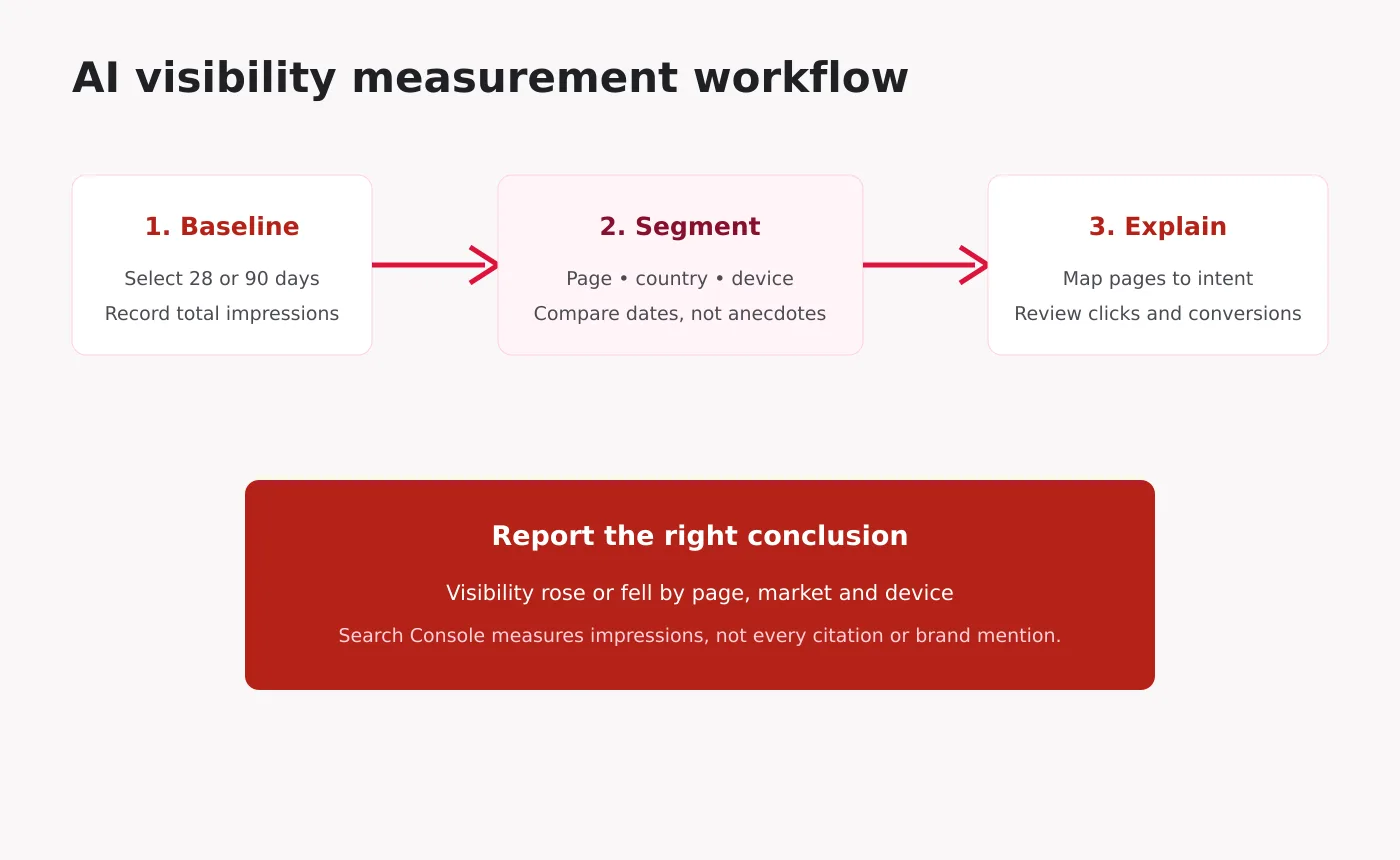
- Select a date range with enough data, usually 28 days for monitoring or 90 days for strategy.
- Confirm the search type you want to analyze.
- Choose Pages, Countries, Dates or Devices above the table.
If the report is absent, the property may not have enough generative AI impressions, access may still be completing for that account or the site may be excluded from Search generative AI features. Check Google’s current eligibility controls before assuming there is a technical error.
Understand each dimension
Pages
The Pages tab groups impressions by the final linked URL after redirects. As in the main Performance report, data is generally assigned to the canonical URL. Use this dimension to find which content types and intents are being surfaced.
Do not judge a page only by its total. Compare AI impressions with the page’s overall Search impressions, clicks, conversions and strategic value.
Countries
The Countries tab shows where searches originated. This is useful because AI feature availability, user behavior and your own content relevance can vary by market. A rise in one country can be hidden inside a flat global trend.
Dates
You can group data by day, week or month. Search Console dates use Pacific Time, which can create small differences when matched to analytics or server logs in another timezone. The newest dotted data is preliminary and may change.
Devices
The Devices tab separates desktop, mobile and tablet. Device patterns can reveal whether AI visibility is concentrated in a particular search context. Apply the same caution used for ordinary mobile and desktop ranking comparisons: different devices may represent different query and country mixes.
Search type
The report supports Web: text-based and Web: multimodal. Multimodal searches include an image as part of the search. Keep search type constant when comparing periods so a change in composition does not look like a performance change.
A reliable measurement workflow
Step 1: Save a baseline
Export the last 90 days and record:
- total generative AI impressions;
- number of pages receiving impressions;
- top pages and their share of total visibility;
- top countries;
- mobile versus desktop share;
- text-based versus multimodal share.
A baseline prevents future reporting from depending on memory or screenshots.
Step 2: Compare periods with context
Compare the last 28 days with the previous 28 days for monitoring. For seasonal topics, compare year over year. Annotate major content updates, migrations, indexing changes and Google rollouts.
Do not interpret a one-day spike as a trend. Preliminary data, query demand and changing AI feature triggers can create volatility.
Step 3: Segment by page
Classify visible pages by intent and template, for example:
- definitions and explanatory guides;
- comparisons;
- how-to content;
- service pages;
- tools and original research;
- author or entity pages.
This reveals what Google is retrieving from your site. A handful of high-impression pages may indicate a successful content pattern, or excessive dependence on one topic.
Step 4: Connect to the main Performance report
AI feature data remains part of the overall Web search performance data. Review the same pages and dates in the main report to understand clicks, CTR, queries and average position. The dedicated AI report isolates visibility, while the main report provides broader search performance context.
Do not subtract AI impressions from total Web impressions and assume the remainder is “classic search” unless Google explicitly documents that calculation for the metric you are using. Aggregation and privacy limits can produce mismatches.
Step 5: Connect to analytics and conversions
In your analytics platform, review organic landing pages, engaged sessions, leads, newsletter signups and revenue. Search Console explains what happened in Google Search; analytics explains what happened after a click.
There may not be a clean AI Overview or AI Mode referral label for every visit. Use page and time-based analysis carefully, and label conclusions as correlations when direct attribution is unavailable.
Metrics worth reporting
|
Metric |
What it answers |
Caution |
|---|---|---|
|
AI impressions |
How often site links appeared in supported AI features |
Not the same as clicks or citations counted by third parties |
|
Visible pages |
How broadly visibility is distributed |
Low-volume pages may be omitted |
|
Top-page concentration |
Whether visibility depends on a few URLs |
High concentration is not automatically bad |
|
Country share |
Where AI visibility occurs |
Market availability and demand differ |
|
Device share |
Which search contexts dominate |
Query mixes may differ |
|
Organic conversions |
Whether search traffic creates value |
Direct AI attribution may be limited |
How impressions are aggregated
The chart is aggregated by property. If two results from the same property appear in one generative AI feature, they count as a single impression in the chart total. When a URL filter is applied, the chart is aggregated by URL.
This can cause chart totals and table totals to differ. The report also follows familiar Search Console limits, including a 1,000-row table limit and privacy-related omission of some data. Exported symbols such as unavailable values may appear as zeros.
What Search Console cannot tell you
The report does not provide:
- the exact text generated for every impression;
- a complete list of prompts or fan-out queries;
- every brand mention where no site link appeared;
- the order or prominence of every cited source;
- competitor citation share across all responses;
- Google’s internal retrieval or ranking signals.
Third-party monitoring can supplement research, especially for a controlled prompt set, but it should not be presented as Google’s internal data. Results can vary by location, account, model and time.
How to turn the report into content decisions
Pages gaining impressions but few clicks
Review whether the page offers a reason to visit beyond the summary. Add a useful tool, detailed method, original screenshots, downloadable template or evidence that cannot fit inside a generated answer.
Pages losing impressions
Check indexing and ordinary Search performance first. Then review freshness, intent match, competing pages and whether the content still adds original information gain. Do not rewrite solely to sound more “AI friendly.”
Pages with no AI impressions
Absence is not proof of failure. The query may not trigger an AI feature, the page may have low demand or the property may not meet reporting thresholds. Prioritize pages based on business and user value, not a requirement that every URL appear in AI results.
A monthly reporting template
- State the date range and whether data is final or preliminary.
- Report total AI impressions and period change.
- List the five pages with the largest absolute gain and loss.
- Break out meaningful country and device shifts.
- Connect those pages to overall organic clicks and conversions.
- Record content or technical changes made during the period.
- Choose no more than three actions for the next month.
Frequently asked questions
Does the report separate AI Overviews from AI Mode?
Google’s current documentation describes one Generative AI performance report that includes both supported capabilities. Do not assume a row belongs to one feature unless the interface explicitly provides that distinction.
Are AI impressions new additions to total Search performance?
No. Google says this data is included in the Web search type of the main Performance report. The dedicated view isolates generative AI visibility for analysis.
Why are there no queries in the dedicated report?
The documented dimensions focus on pages, countries, dates and devices. Use the main Performance report for query analysis, while recognizing that it may not label each query as an AI feature impression.
Should I optimize for more AI impressions or more clicks?
Optimize for useful visibility that contributes to business or audience goals. Impressions show reach. Clicks, engagement, leads and revenue show whether that reach was valuable.
Final takeaway
AI search visibility is now measurable inside Search Console, but the metric needs disciplined interpretation. Establish a baseline, segment by page and market, connect the trend to ordinary Search and analytics, and be explicit about what the report cannot prove. The goal is not to collect the largest possible impression count. It is to understand where Google is surfacing your work and whether that visibility helps the right audience.