Disclosure: I represent the plaintiffs in the anti-competitive gerrymandering case discussed in this post.
The Wisconsin Supreme Court recently heard arguments in a pair of redistricting cases that are unusual (though not unique) in that they allege both partisan and anti-competitive gerrymandering. The assertion of both claims raises the question of how analyzing partisan effect is similar to, and how it differs from, analyzing anti-competitive effect. To shed some light on this issue, I use Texas’s 2022 congressional plan as a case study; it’s a good example of a map that’s egregious in both partisan and anti-competitive terms. I rely on the computational redistricting method that’s the staple of recent litigation. I borrow the “off the rack” 5000-map ensemble made available for Texas (and every other state) by the ALARM Project. And I present evidence of both partisan and anti-competitive effect, both plan-wide and in specific districts.
Elections: In any case in which computational redistricting is deployed, an expert must decide which elections to use in the analysis. The most common approach is to use statewide races (like for governor, senator, or president) over multiple years. Statewide races eliminate district-by-district variations in candidate quality since the same candidates compete in all districts. Elections over multiple years incorporate waves in both directions, strong and weak candidates, independents breaking one way or another, and other idiosyncrasies. Election results are typically reported by precinct, and these precinct figures are then aggregated to districts—either actual or computer-generated ones. For reference, the ALARM Project’s Texas study uses the results of six statewide races from 2016 to 2020.
Parameters: In any computational redistricting case, an expert must also decide which parameters to include in the mapmaking algorithm. All applicable federal and state legal criteria must certainly be included. Traditional criteria like compactness and respect for political subdivisions may be included even if they’re not mandatory. Many political factors may be included as well: for example, respecting communities of interest, not pairing incumbents, and placing neighborhoods, businesses, and/or donors in particular districts.
The only parameter that can’t be included in the algorithm is the very thing being tested for. In a racial gerrymandering case, the algorithm can’t set a target for a district’s racial composition. In a partisan gerrymandering case, biasing the plan in a party’s favor can’t be an objective. And in an anti-competitive gerrymandering case, shielding favored candidates from competition can’t be a goal. Not only is the level of competition the subject of the inquiry, but the Supreme Court explained in LULAC v. Perry that “protect[ing]” a legislator “from a constituency that [is] increasingly voting against him” is a “tenuous”—even a “suspect”—aim. If “incumbency protection means excluding some voters from the district simply because they are likely to vote against the officeholder, the change is to benefit the officeholder, not the voters.”
For reference, the ALARM Project’s Texas study uses only federal legal criteria (population equality and compliance with the Voting Rights Act). This is because Texas has no legal criteria of its own for congressional districts.
Plan-Wide Comparisons: After the algorithm has churned out many (typically thousands of) maps satisfying all relevant criteria, any plan-wide statistic may be calculated for both the challenged plan and all the computer-generated maps. The performance of the challenged plan may then be compared to the distribution of scores for the computer-generated maps. If the challenged plan is at the edge of, or even outside, that distribution, this fact supports inferences that the plan was intentionally drawn to behave that way, that the plan has a substantial effect with respect to the statistic at issue, and that no legitimate factor can account for this impact.
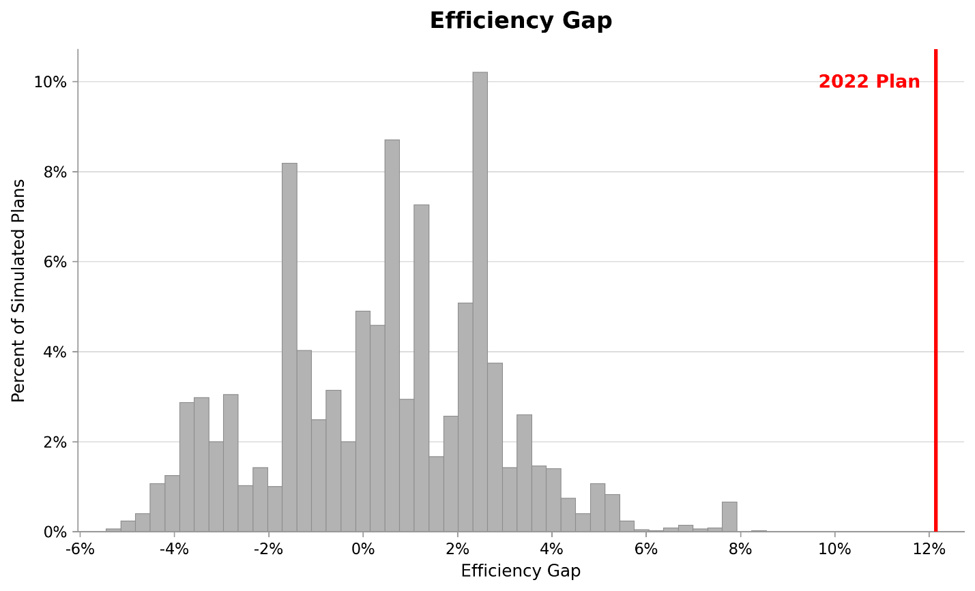
To make this discussion more concrete, the efficiency gap is a measure of partisan bias commonly used in partisan gerrymandering litigation. It captures the extent to which one party “wastes” more votes than its rival because of the cracking and packing of its voters. The below chart displays the efficiency gap of Texas’s 2022 congressional plan versus the efficiency gaps of the 5000 maps in the computer-generated ensemble. The 2022 plan’s efficiency gap of roughly 12% in a Republican direction lies far outside the entire distribution for the map ensemble, whose median is close to 0%. This is powerful evidence that the 2022 plan was an intentional, effective, and unjustified partisan gerrymander.
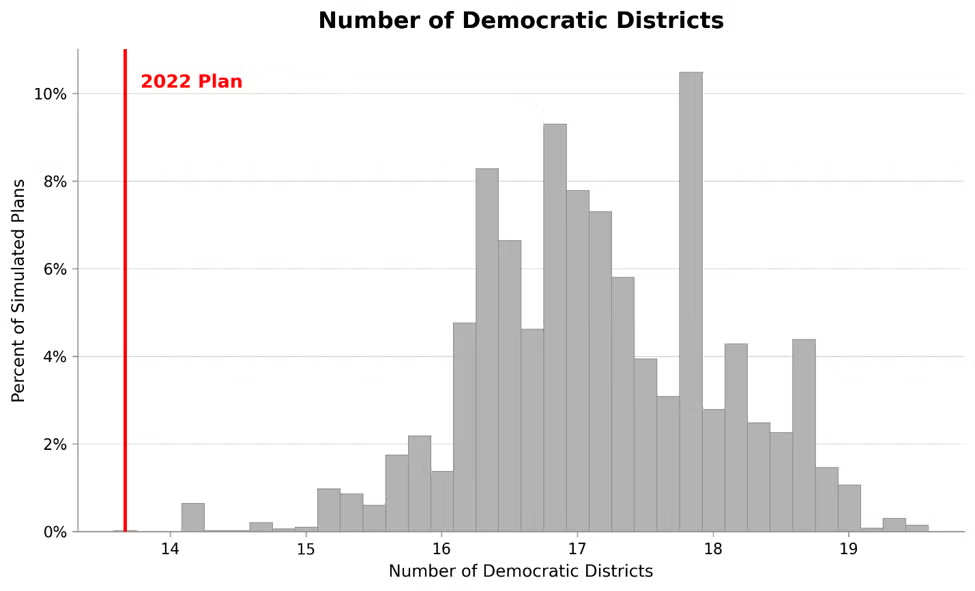
While the efficiency gap is easy enough to compute, some prefer looking at the volumes of seats forecast to be won by each party. The next chart therefore shows the number of Democratic districts in Texas’s 2022 congressional plan versus these numbers for the 5000 maps in the computer-generated ensemble. The 2022 plan’s 13.7 expected Democratic seats fall outside essentially the entire distribution for the map ensemble, whose median is 17 expected Democratic seats. Again, this evidence is highly suggestive of an intentional, effective, and unjustified partisan gerrymander.
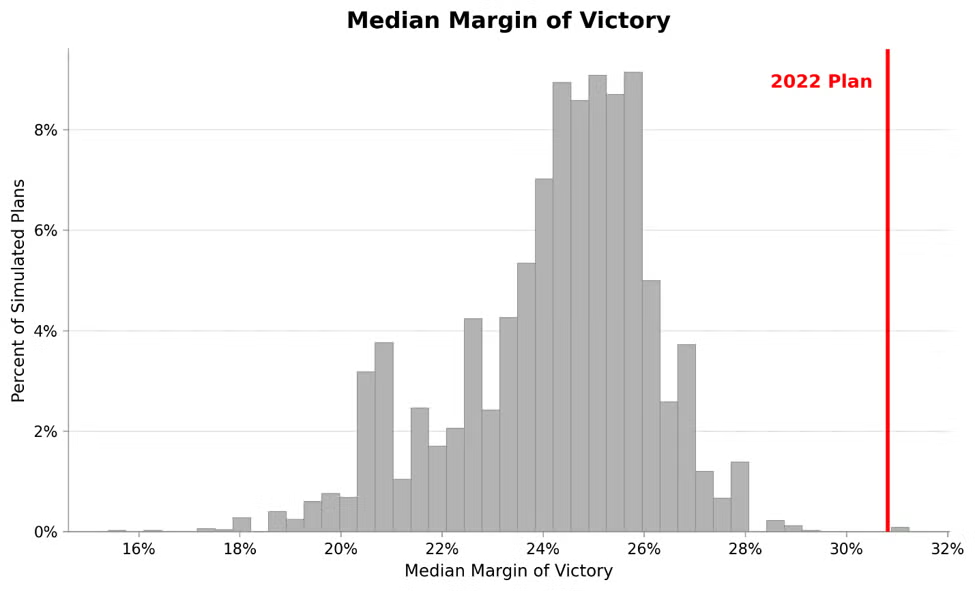
Turning from partisan to anti-competitive gerrymandering, a standard measure of plan-wide competitiveness is the median margin of victory across all districts. This is simply the median (or midpoint) of all districts’ individual margins of victory. A lower median margin indicates more overall competitiveness than a higher median margin. The below chart displays the median margin of Texas’s 2022 congressional plan versus the median margins of the 5000 maps in the computer-generated ensemble. The 2022 plan’s median margin of about 31% lies outside essentially the entire distribution for the map ensemble, whose median is close to 25%. This is powerful evidence that the 2022 plan was an intentional, effective, and unjustified anti-competitive gerrymander.
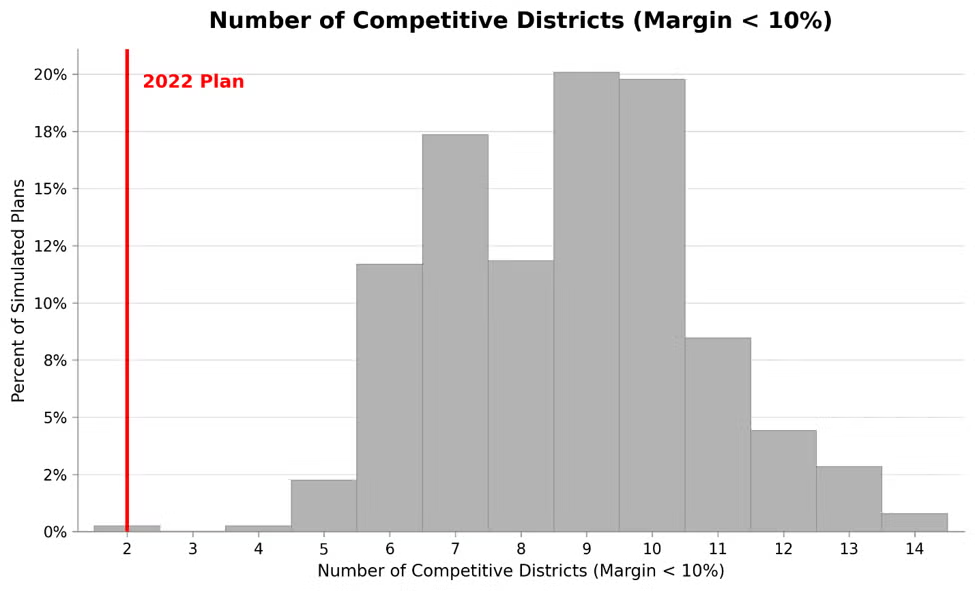
Another measure of competitiveness is the volume of competitive districts in a plan. A district is often deemed competitive if its margin of victory is below 10%. This approach is cruder than the last one because it treats districts in binary terms—either competitive or not—and discards all other information. Nevertheless, the next chart shows the number of competitive districts in Texas’s 2022 congressional plan versus these numbers for the 5000 maps in the computer-generated ensemble. The 2022 plan’s two competitive districts fall outside essentially the entire distribution for the map ensemble, whose median is nine competitive districts. Again, this evidence is suggestive of an intentional, effective, and unjustified anti-competitive gerrymander.
District-Specific Comparisons: The analysis so far has all been plan-wide and thus relevant to legal challenges against plans in their entirety. But courts sometimes conceive of gerrymandering claims as district-specific instead of, or in addition to, plan-wide. For instance, racial gerrymandering claims are exclusively district-specific. Racial vote dilution claims under the Voting Rights Act vary in scope based on the area in which dilution is alleged. And in Gill v. Whitford, the Supreme Court briefly treated partisan gerrymandering claims as district-specific before deeming the whole cause of action nonjusticiable a year later. Even if claims are plan-wide, district-specific evidence is very informative because it highlights where and how plans’ overall partisan bias or lack of competition arises.
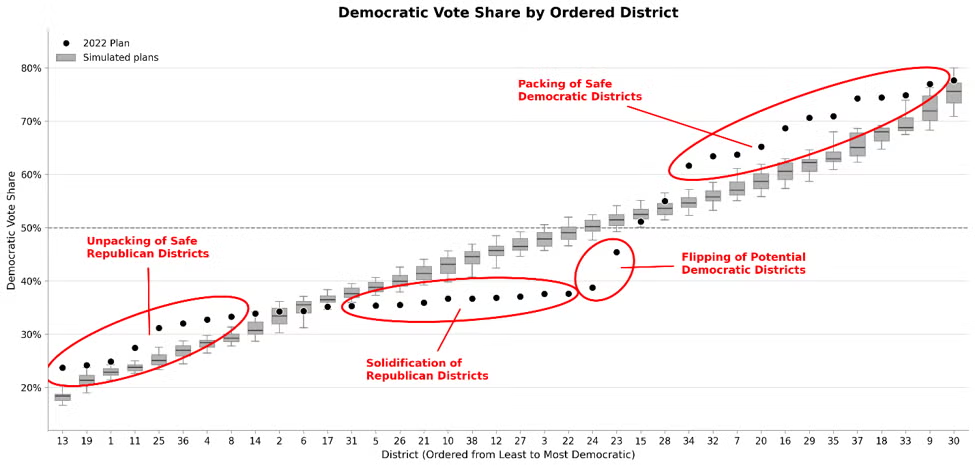
To illustrate, the below chart plots the 38 districts in Texas’s 2022 congressional plan as black circles from least to most Democratic. The box-and-whiskers plot in the same vertical file as each black circle summarizes the Democratic vote shares of the 5000 computer-generated districts corresponding to each enacted district. Proceeding from left to right, the chart depicts the various strategies used to benefit Republicans and disadvantage Democrats.
The first eight districts (13 through 8) are all less Republican than their corresponding box-and-whiskers plots. These are safe Republican seats made somewhat less heavily Republican to avoid wasting as many Republican votes. The next ten circled districts (31 through 22) are all more Republican than their corresponding box-and-whiskers plots. These are safe Republican seats made more Republican to ensure they wouldn’t flip under any plausible circumstances. Districts 23 and 24 are then Republican districts most of whose corresponding computer-generated districts are Democratic. These are seats that favor Republicans even though Democrats would usually win them in plans designed without partisan intent. Finally, the last eleven circled districts (34 through 9) are all more Democratic than their corresponding box-and-whiskers plots. These are safe Democratic seats packed even more heavily with Democratic voters to waste more of their votes.
Again, this district-specific evidence could be used for either of two purposes. It could support district-specific partisan gerrymandering claims against unnecessarily cracked or packed districts (districts outside their corresponding box-and-whiskers plots). Or, in the context of a plan-wide challenge, it could simply illuminate the methods that account for the 2022 plan’s large overall pro-Republican bias.
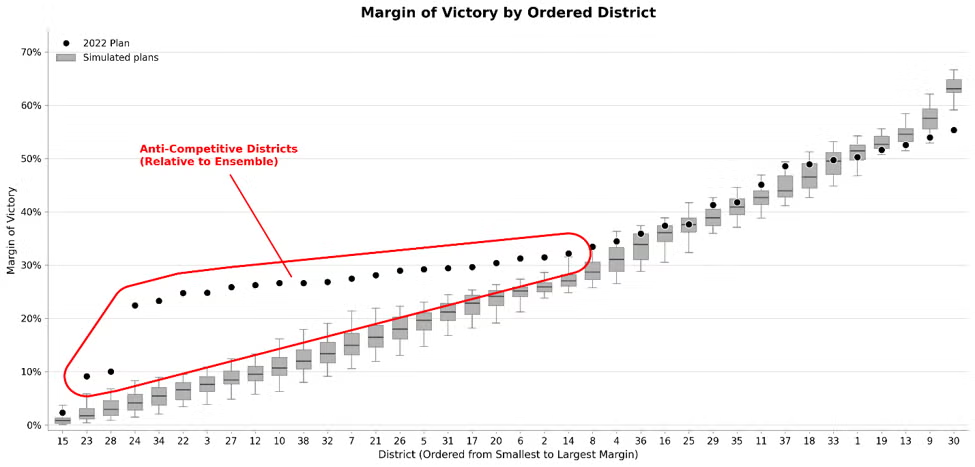
Turning from partisan to anti-competitive gerrymandering, the relevant district-specific information is the margin of victory, not the Democratic vote share. The Democratic vote share reveals which party is favored to win each district. But this is irrelevant to anti-competitive gerrymandering, which is concerned with only the closeness (not the winners) of races. The below chart therefore plots the 38 districts in Texas’s 2022 congressional plan as black circles from smallest to largest margin of victory. The box-and-whiskers plot in the same vertical file as each black circle summarizes the margins of victory of the 5000 computer-generated districts corresponding to each enacted district.
In the chart, twenty-one districts (23 through 14) are circled because their margins of victory are higher than those of the districts in their corresponding box-and-whiskers plots. A couple of these districts (23 and 28) are reasonably competitive in absolute terms. But both these two districts and the remaining nineteen are comparatively uncompetitive—relative to corresponding districts satisfying all relevant criteria and produced without trying to stifle competition.
Once more, this evidence could support district-specific anti-competitive gerrymandering claims against the twenty-one comparatively uncompetitive districts. Or, in the context of a plan-wide challenge, it could pinpoint the individual districts that explain the 2022 plan’s low overall level of competition.
Wisconsin: Of course, all this data has been about Texas. What would analogous data show about Wisconsin’s congressional plan? It would tell a similar substantive story about anti-competitive gerrymandering. As a whole, the plan has a higher median margin of victory than the vast majority of computer-generated maps. Most of the plan’s individual districts are also more lopsided than their computer-generated counterparts.
The partisan gerrymandering picture might be different. Specifically, Wisconsin’s congressional plan may well sit in the heartland—not the tail—of the map ensemble in terms of its efficiency gap, expected Democratic seats, and other partisan metrics. True, computational evidence is only one component of a partisan gerrymandering case, and other facts matter too. But if the ensemble evidence comes out that way, the partisan and anti-competitive theories would diverge with respect to liability. A court that recognized only the partisan theory, then, wouldn’t merely narrow these cases. It would also set the stage for the plan’s ultimate survival.